01 / the period deck Every plan

The period deck

An editable PowerPoint at the end of every period, monthly by default, or every two weeks or weekly. Not a sheet of numbers: each competitor's period written up per category, their biggest change, every campaign side by side, the accounts ranked by their best post, and what to watch next. Open a demo to see what every page tells you.

Demo reports only. The brands, numbers, post selection and copy are made up, and yours will differ. A real report on six accounts runs to around 20 pages of useful, verified data; each demo shows 9 of them.

01 / Streetwear Demo
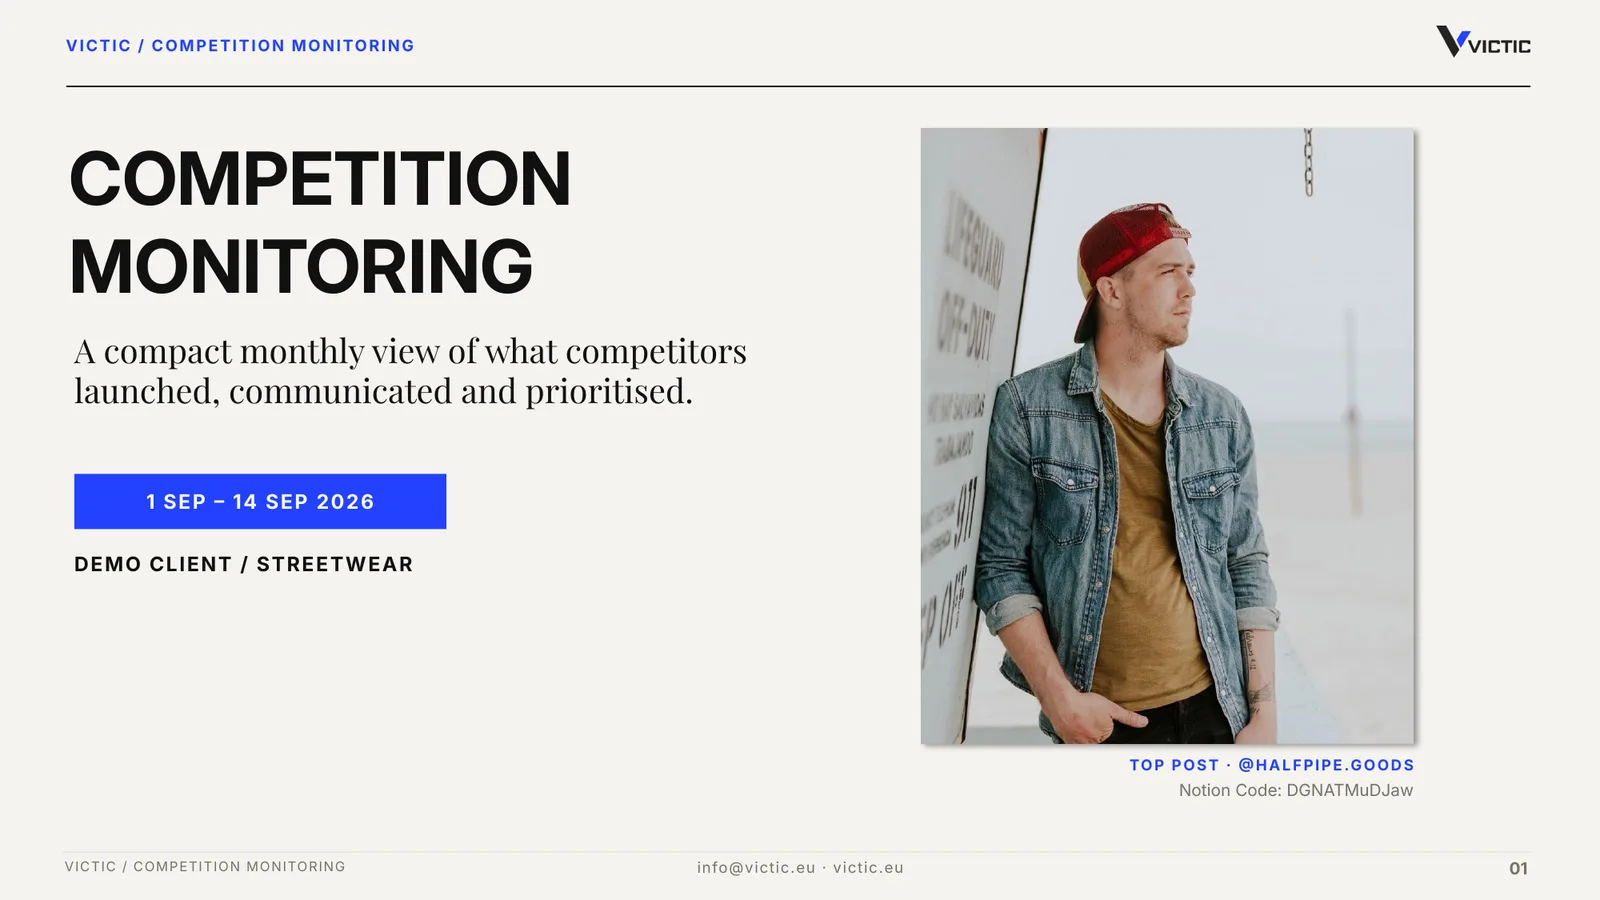
Six streetwear labels over two weeks: what each one dropped, who it teamed up with, which campaigns it ran, and the post that beat its own usual numbers by the most.

  • 6 accounts, 72 posts, 152 stories
  • Drops, collaborations and campaigns per label
  • Top post per account against its typical post
  • 9 of around 20 pages
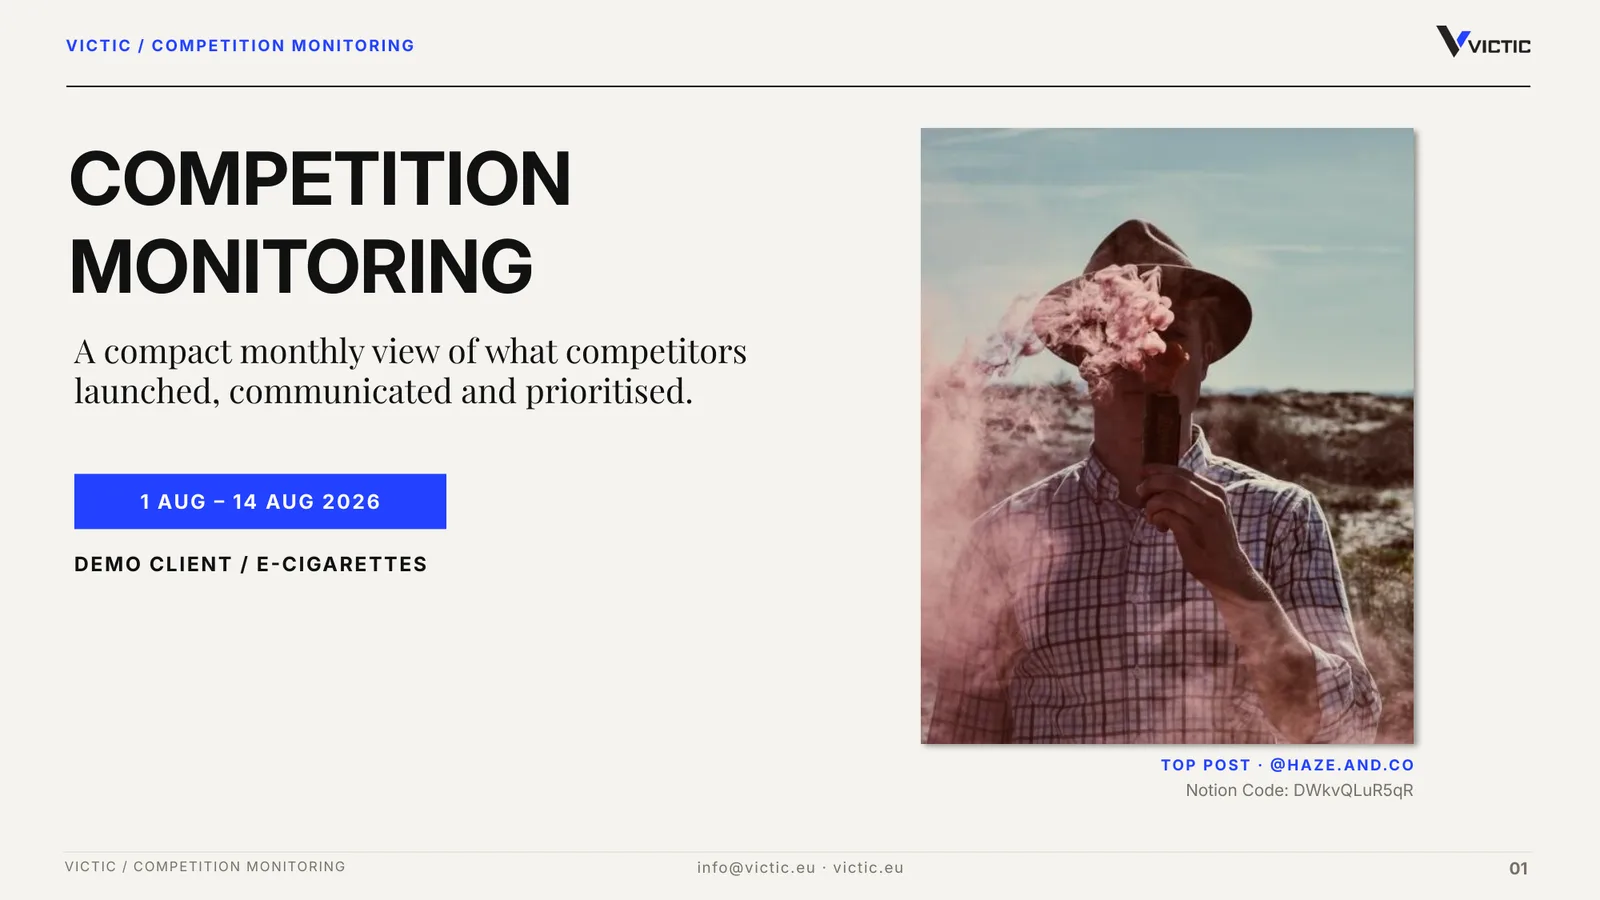
02 / E-cigarettes Demo

Six e-cigarette brands over two weeks. New flavours, store openings, campaigns and responsible-use messaging, brand by brand.

  • 6 accounts, 60 posts, 166 stories
  • Launches, retail and campaigns per brand
  • Top post per account against its typical post
  • 9 of around 20 pages

Demo only: brands, numbers, posts and copy are invented. A real six-account report runs to around 20 pages.

What a deck is made of

The same five parts, every period

The same structure every time, so periods and accounts compare side by side. With white label it carries your logo and colours instead of ours.

01

Group overview

Posts, stories, likes and comments across every account, then one table of who posted what, their main focus and their top post.

02

Account by account

Each competitor's volume, content focus and top post, then what they did, grouped by content category.

03

Across the field

What is new, campaigns and activations, collaborations, and each category compared across all accounts.

04

Top content

Each account's best post against its own typical post, with a code that finds it in your Notion feed.

05

Period summary

The standouts of the period, from the most active account to the strongest outlier, and what to watch next.

02 / the live feed Pro and Scale

The live feed in Notion

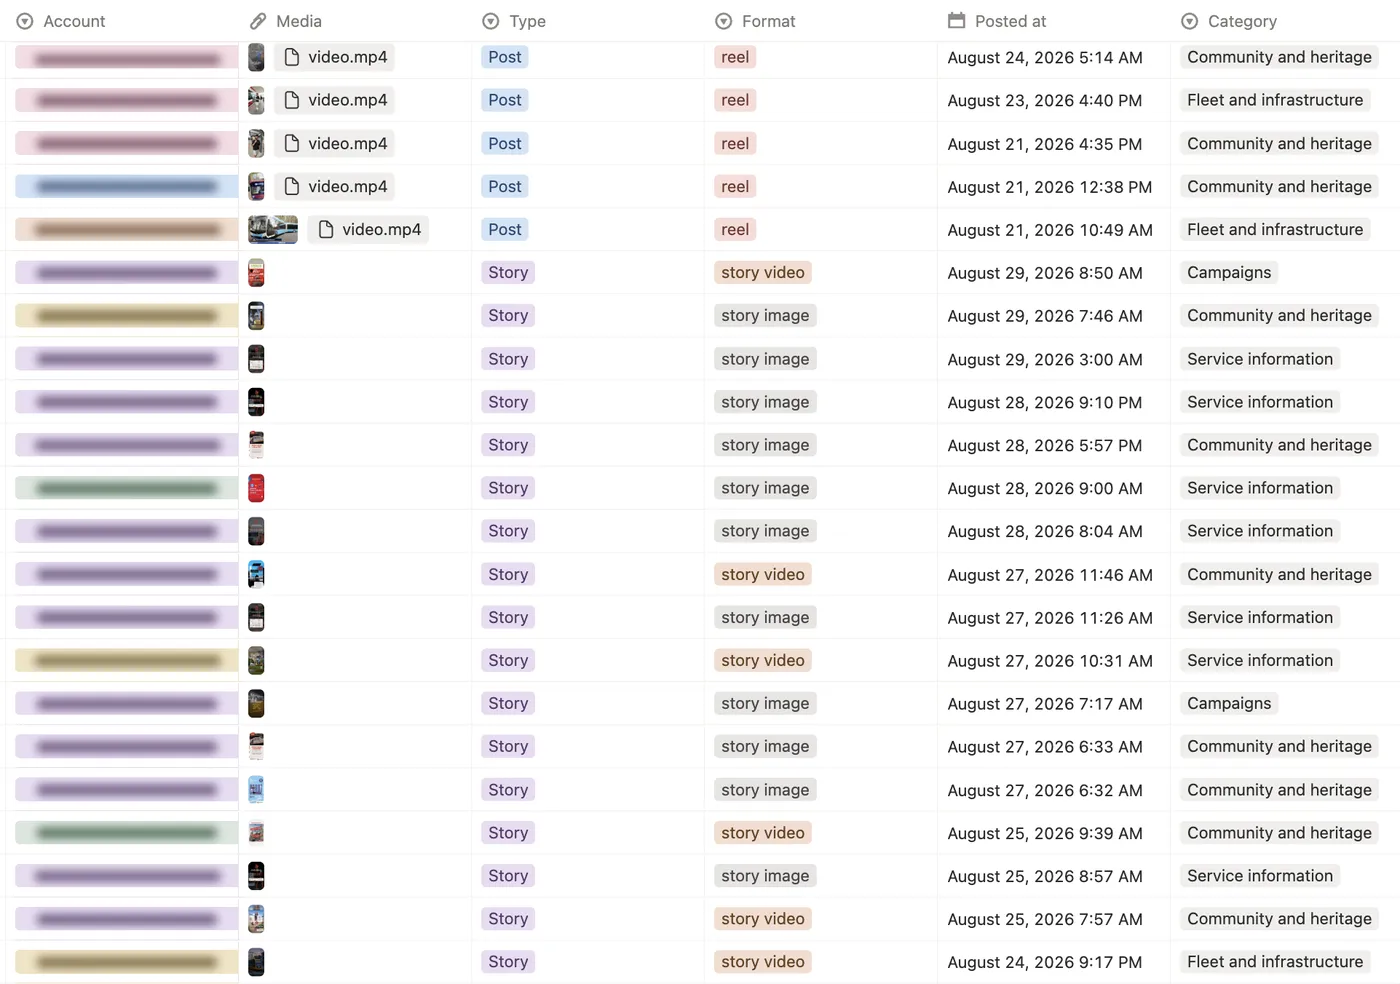
Your own Notion database, where every captured post and story becomes a row as it comes in, with its media inside it. It is the place to look between reports, and the place a report's post codes point to.

  • One row per itemPosts and stories of every account, with the picture or video
  • Filter and sortBy account, format, category, date or engagement
  • Your notes stayNotes and stars you add are kept every time the feed refreshes
  • Honest scoresEach post's score against its own account, or why it has none yet
  • Still countingA post shows whether its numbers are still being measured or final
  • Post codesType a code from the deck to open that post with all of its data
The live feed in Notion: one row per post and story with its media, type, format, posting time and category. Account names are blurred.
The live feed in Notion, from a real dataset. Account names blurred.
03 / the live folder Every plan

The live folder on Google Drive

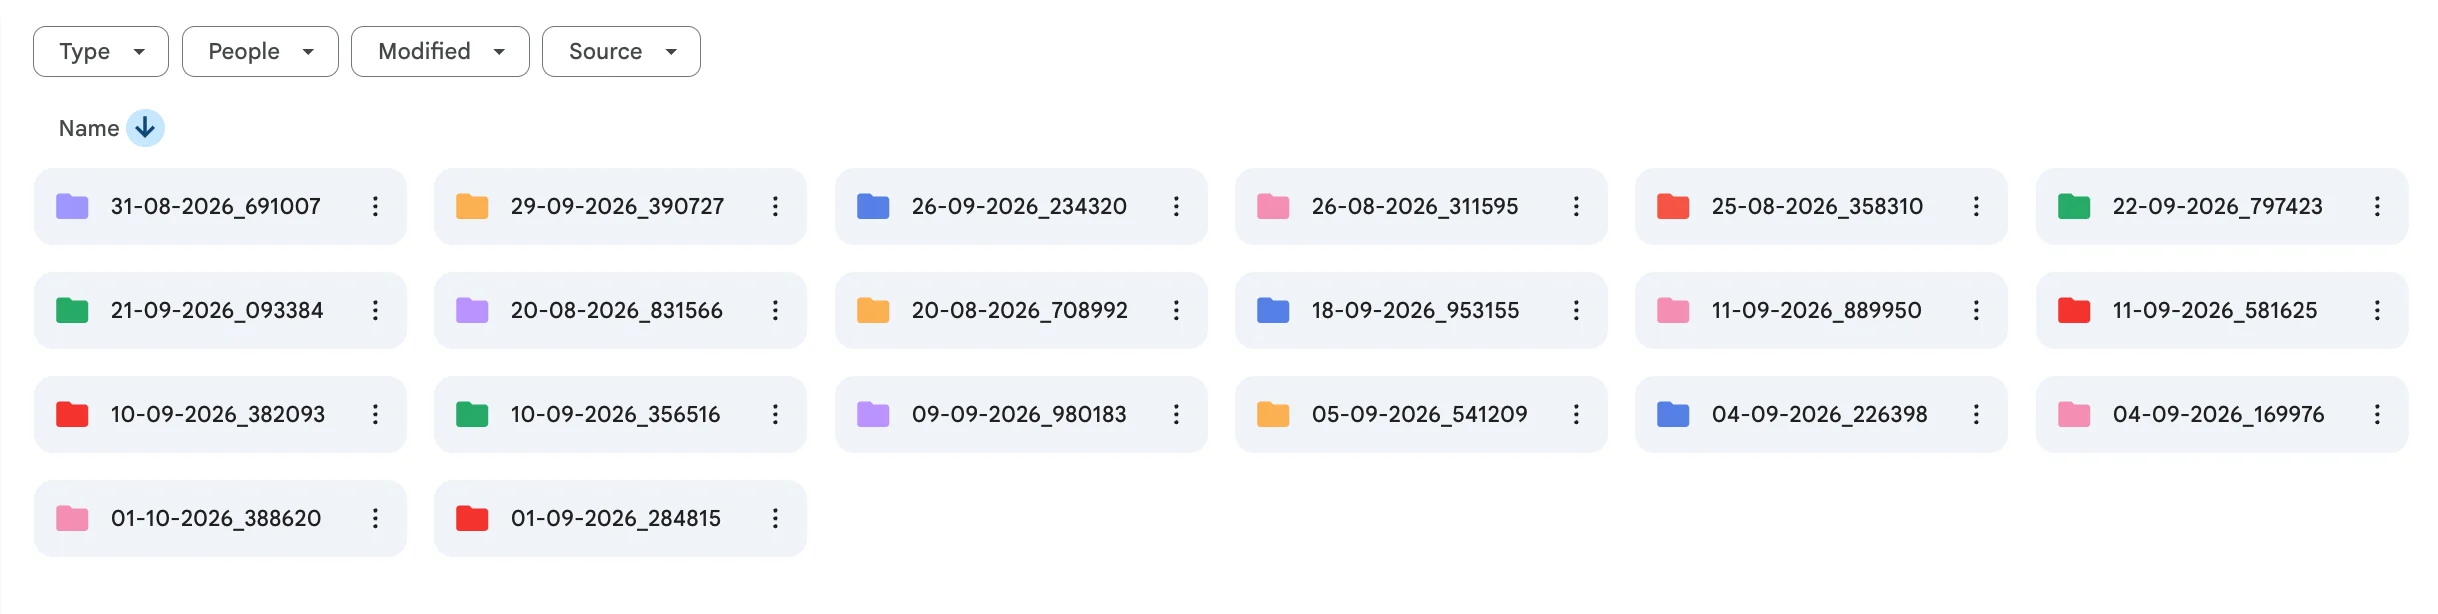
A shared Google Drive folder that fills up every night with what was captured that day. Nothing to install and nothing to log into: it is shared with the addresses you give us, and opens like any other folder.

  • By accountOne folder per competitor handle
  • Posts and storiesSplit into their own folders, one per post, stories by day
  • Dated namesEvery folder starts with its date, so the newest are easy to find
  • Original filesThe full image or video, not a thumbnail
  • Next to itYour decks and archive bundles land in the same shared drive
  • Recent weeksA rolling window; the whole period is kept in the archive bundle
The live folder on Google Drive: one folder per post, each named with its date
A competitor's Posts folder on Drive, one folder per post, named by date.
04 / the archive bundle Every plan

The archive bundle

At the end of each period, every captured file in one zip, with two spreadsheets that list every post and story and their data. Download it and it is yours, whatever happens next.

  • Every fileEach image and video of the period, in full quality
  • Two spreadsheetsPosts.csv and stories.csv, one row per item
  • The data with itPosting time, category, description, hashtags, mentions, collaborators, music, paid partnership, location, likes and comments
  • Opens in ExcelAccents and local characters included
  • Never partialIf a single file cannot be fetched, the bundle is not delivered with a hole in it
  • Six monthsWe keep delivered decks and bundles for six months; download them to keep them for good
streetwear_1–30_September_2026.zip
posts.csv
stories.csv
@label_one/
  posts/2026/09/one folder per post/
  stories/2026/09/one folder per story/
@label_two/
  posts/2026/09/...
  stories/2026/09/...
...
The free first report

You see the real thing
before you decide

The first report is free and it is not a teaser version.

Send the handles you want watched. We start capturing, and after one or two weeks, whichever you choose, you get the full Basic deck on up to five of those accounts. If it is not worth paying for, you keep it anyway and we stop. The reason we can offer that is that the capture is already running; adding your accounts to it costs us far less than convincing you with a slide about ourselves.

Once you are a client the period is yours to set, down to a daily report if the work needs one. Capture runs every day either way.